


In the September 2021 issue, Sebastian Gonzalez investigates artificial intelligence (AI) software to examine violin forms
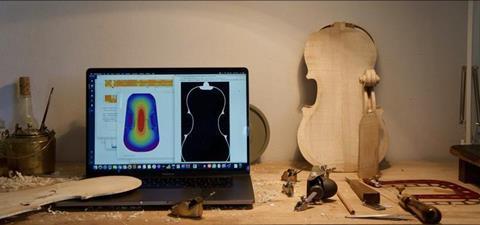
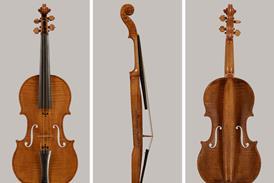
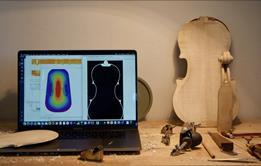
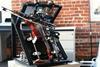
Photo: Sebastian Gonzalez
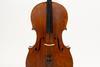
The computer screen shows a height map of the 1716 ‘Messiah’ Stradivari violin, taken from a 3D scan (left); and an X-ray of the ribs of the 1718 ‘San Lorenzo’ Stradivari (right)
The following extract is from The Strad’s September 2021 issue feature ‘Violin Making and AI: Intelligent Design’. To read it in full, click here to subscribe and login. The September 2021 digital magazine and print edition are on sale now
The idea that the shape and thickness of a violin’s top and back plates can affect its sound is nothing new. Antonio Stradivari was undoubtedly aware of it 300 years ago, and the science behind it was scrutinised and written up at length by Carleen Hutchins in the 1950s. Since then, the phenomenon of violin ‘modes’ and resonances has been investigated by both violin makers and academics; indeed, for many luthiers, one of the first steps in making a new instrument will be to examine its ‘tap tones’, or speed of sound along the plates. But what if we could predict how an instrument will sound even before we build it? Could it be possible for modern technology to give an idea of the final plates’ vibrational behaviour, and even understand how a good violin could be made to sound ‘great’?
A team from the Politecnico di Milano’s musical acoustic laboratory has recently completed a project using artificial intelligence (AI) software to examine violin forms. The study demonstrates that a simple neural network can learn to predict the way a violin’s top plate will vibrate, just from parameters relating to its geometry and material. For this project, we took a fundamentally different approach from the standard method of investigation – which, in a nutshell, is ‘varying X while leaving everything else constant’. In other words, you start with a model of a violin, vary one parameter at a time, and see how the instrument’s eigenfrequencies change as a result of varying that one parameter. The eigenfrequency (or ‘modal frequency’) is the frequency at which a system tends to oscillate in the absence of any driving or damping force, and the shape this vibration has in space is called the ‘normal mode’. These modes can be understood by analogy to the vibrations of a string, where the fundamental is always accompanied by several harmonics: these are the normal modes of a string.
Conversely, in our approach we varied all the variables of our violin top plates at the same time, and used AI software to figure out the correlations between parameters and eigenfrequencies. So when people ask us, ‘What happens when we vary X?’ we have no answer, because it depends on how all the other variables of the violin are set. However, the AI will give us the answer for any particular configuration. Note here that the answer we get is in terms of eigenfrequencies, not in terms of violin tone quality (as in ‘good’ or ‘poor’). How the eigenfrequencies are correlated to what we hear as good tone is a completely different can of worms.
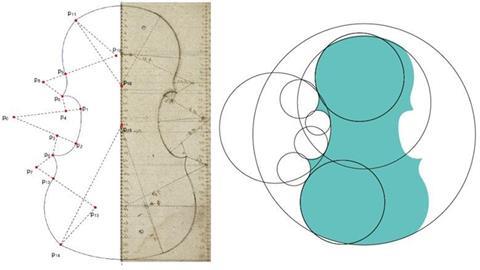
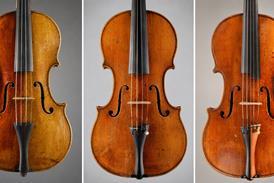
Photo: Ceruti drawing courtesy Museo del Violino
FIGURE 1 A c.1800 drawing from the Enrico Ceruti workshop (left), showing the radii and centres of the circles that make up a violin outline (right). These points formed the parameters that would be inputted into the AI software
To train a neural network, one needs a generally large dataset. We had some violins scanned from the collection of Cremona’s Museo del Violino, but only perhaps a dozen or so, and not all of them usable. So the first task was to come up with a good parametrisation of the violin – that is, a set of numbers that can be used to describe any violin. We discovered the solution to this in the Museo’s collection, in the form of a drawing from the workshop of Cremonese maker Enrico Ceruti (figure 1). The drawing shows how the outline of a violin can be created from a series of circular sections. Thus, the coordinates, radii and angles that describe these various sections become the parameters of the outline. I simply uploaded the Ceruti drawing into my computer, and started to play with the numbers to obtain numerous reasonable outlines.
The idea of applying a neural network to musical acoustics still seemed quite far-fetched, and we focused mostly on having a good model of violin to start with. Among the Museo’s 3D scans of historical instruments, is Stradivari’s 1716 ‘Messiah’, which in 2016 was brought over from Oxford’s Ashmolean Museum on loan, to spend its 300th birthday in Cremona. On that occasion, the Politecnico di Milano together with the University of Pavia scanned the violin while performing other experiments. The advantage of having a scan of the instrument, besides its extreme accuracy, is that we could get a more complete idea of its arching than can be obtained from simple shop drawings.
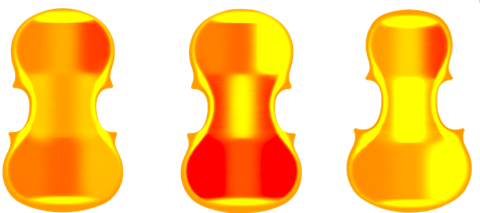
Photo: Sebastian Gonzalez
FIGURE 2 Examples of the thickness distribution of the violin top plates, with thin regions marked in red and thick regions in yellow. Notice how the random sampling of the outline parameters creates shapes that would be rather unusual for a violin that really existed
My colleague, the mandolin player Davide Salvi, did some optimisation and managed to find a set of parameters that approximated the outline of the ‘Messiah’ with an area difference less than one per cent. For the longitudinal arching we used a simple polynomial formula that gives the ‘Messiah’ arching as a function of the position from neck to tailpiece. For the transverse arching of the top we decided to go with a mathematical formulation that can be easily implemented for any violin outline. The idea behind this is that by parametrising the arching as a polynomial function, in the future we will be able to vary them at will in a straightforward way. The plate thickness also has its own challenges, since to obtain a smoothly varying surface on the inside, one needs to be quite careful. As a compromise between historical accuracy and ease of implementation, we chose to have nine different thickness regions in the plate: three in the upper region, three in the centre, and three in the lower part (figure 2). The resulting violin top plates are clearly not realistic, but that is precisely the idea. By training the neural network for a number of possible configurations, we teach it to recognise the relationship between the different parameters and the eigenfrequencies. Besides, we can easily expand the number of regions later to an arbitrary high number. We have always seen this research as a first step in a long path towards the accurate simulation of violins with the help of AI.
Read: Violin making and AI: Intelligent design
Read: Wood densitometry: Material facts
-
This article was published in the September 2021 Suzuki issue
How the intuitive teaching method has become an unparalleled success around the globe since its founding in 1945. Explore all the articles in this issue
More from this issue…
- The Suzuki teaching method
- Why conservatoires should embrace HIP
- The great antiquing debate: experts weigh in
- Violin making and AI
- Soviet cellist Daniil Shafran
- Choosing the right sized viola
Read more playing content here
-


Topics
Violin making and AI: Intelligent design
The science of violin acoustics has encompassed 3D scanning, CNC technology and good old-fashioned tap tones – so why not AI software? Sebastian Gonzalez presents the results of a project that could help predict an instrument’s tone qualities even before it’s made
- 1
- 2
- 3
- 4
 Currently
reading
Currently
reading
Using Artificial Intelligence in violin making
- 6
- 7
- 8


No comments yet